|
This time, we are going to explain the peak search in peak search analysis, which is one of the spectrum analysis functions installed in our DSP
and MCA.
During normal measurements, tasks such as parameter settings, spectrum
acquisition, and ROI calculations are typically performed on main. I believe this is sufficient for general measurements; however, for more
in-depth spectrum analysis, go to Tool → Peak Search Analysis in the menu.
To perform detailed analysis using peak search analysis, first create both an energy calibration file and a FWHM calibration file.
The accuracy of the calibration file directly impacts the results of spectrum
analysis. Therefore, it is recommended to create the calibration file using
spectra that have been measured for as long as possible and have few statistical
errors. It is possible to perform spectrum analysis using peak search analysis without creating a calibration file, but since the parameters are fixed,
the wider the range, the more errors will occur in the calculation.
As shown in Fig. 1, set the ROI as evenly on the left and right as possible and narrow it to the peak to avoid including the background.
|
|
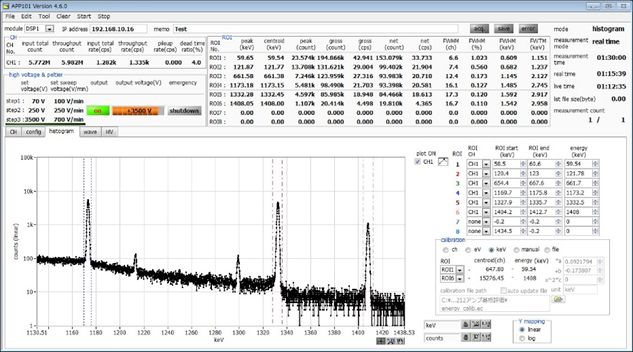
Fig. 1 ROI settings on main screen
|
|
Once enough spectrum data has been accumulated, select Create Energy Calibration File from Tools to create Eq. (1) Energy calibration formula.
|
|

Energy: γ-ray energy (keV)
a,b,c: Coefficients of energy calibration formula
P: centroid(ch) Peak median value
|
|
The ROI values set on the main screen will be displayed, so please check ON/OFF box for the ROI you wish to use.
When you press Create File button, the coefficients will be calculated using the least squares method. You
will then be prompted to specify the save location for the file; set it
and save.
On the main screen, by checking File check box and specifying the energy calibration file, the x-axis of the graph will be updated to display energy (keV). Peak Search Analysis will inherit the energy calibration settings from main.
|
|
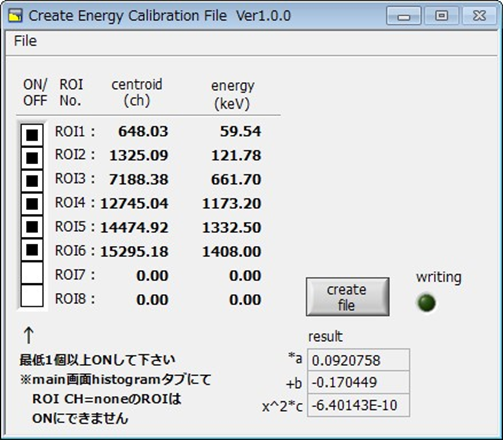
Fig. 2 Energy calibration file creation screen
|
|
Next, please select create FWHM calibration file from Tool and create Eq.(2) FWHM calibration formula.
|
|

FWHM: Half width (ch)
a,b,c: Coefficients of energy calibration formula
P: centroid(ch) Peak median value
|
|
The ROI values set on the main screen will be displayed, so please check
ON/OFF for the ROI you wish to use. When you press Create File Button, the coefficients will be calculated using the least squares method.
When you press the create file button, the coefficients are calculated using the least squares method. You will then be prompted to specify the save location for the file; set it and save.
Eq.(2) The accuracy of the FWHM calibration formula is poor unless there are 3 or more points. If the score is 2 or less, please set Calibration Select to Manual for peak search analysis.
In peak search analysis, if calibration select is set to file, ROI will be automatically assigned after peak detection according to Eq.(2) FWHM calibration formula from that file.
The actual FWHM calculation is performed by subsequent Gaussian fitting,
so it does not affect the measurement results. It is only used to determine
the ROI of the calculation range.
FWHM calibration file must be re-taken when the resolution changes, such as when changing the
full scale or changing the time constant (risetime).
|
|
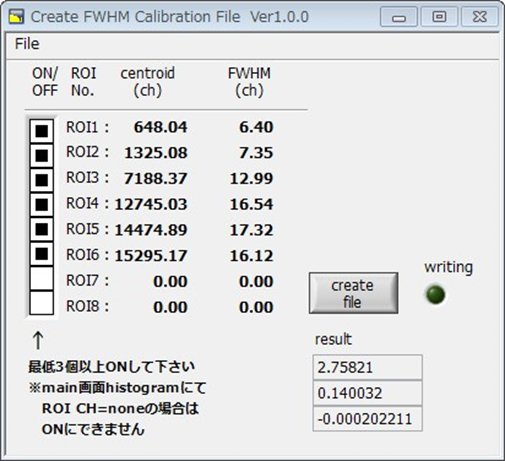
Fig. 3 FWHM calibration file creation screen
|
|
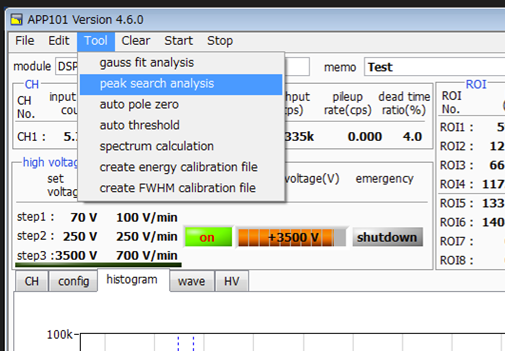
Fig. 4 Select peak search analysis
|
|
As shown in Fig.5, when the data source is set to online, search mode to auto, and a file is specified, peak search will be performed automatically at the set update interval (sec).
The width of the second-order differential filter function is calculated by automatically calculating the width corresponding to the energy from Eq. (2) FWHM calibration formula.
Assign the ROI to the detected peak from ROI range by multiplying FWHM calculated from Eq. (2) FWHM calibration formula by a constant. For manual, create
Eq. (6) second-order differential filter function with the width of FWHM
for search (ch) and perform peak search. ROI range selects the specified
channel.
For manual, create Eq. (6) second-order differential filter function with the width of FWHM for search (ch) and perform peak search. ROI range selects specified channel
|
|
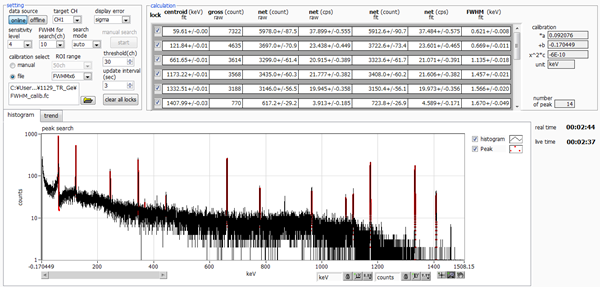
Fig. 5 entire spectrum
|
|
After performing peak search and assigning ROIs, perform Gaussian fitting
on the peaks. Then calculate the peak area using the Covell method. Finally,
calculate the net counting rate by dividing by the dead time corrected
live time.
1. peak search
2. Calculate each parameter using Gaussian fitting
3. After calculating the peak area, obtain the net counting rate from live time.
We just focus on discussing peak search this time. Hence, I plan to cover topics such as No.2 (Calculate each parameter using Gaussian
fitting) and No.3 (After calculating the peak area, obtain the net counting rate from live time)as well.
Fig.6 and Fig.7 shows the case ROI range is set to manual. Even if I set it to 122keV, which works well, it becomes too narrow
at 1.33 MeV.
|
|
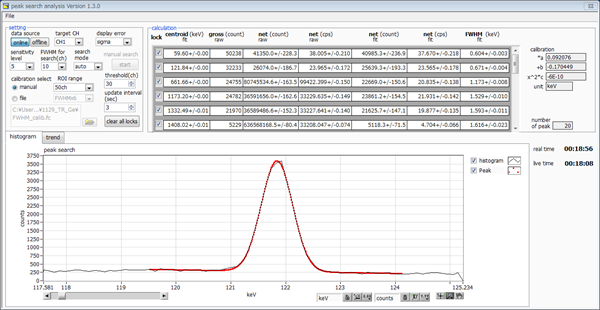
Fig. 6 ROI range manual @ 122keV
|
|
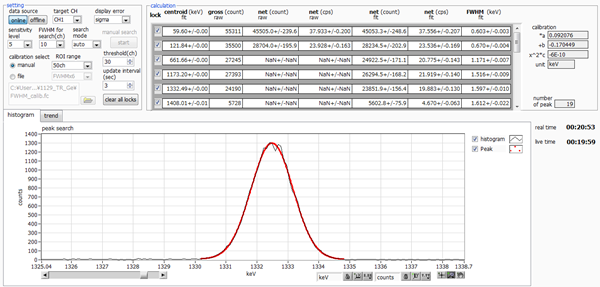
Fig. 7 ROI range manual @ 1.33MeV
|
|
In Fig. 8 and Fig. 9, ROI range is set to file, so the ROI is assigned based on the FWHM calibration formula for each
energy. As a result, both 122 keV and 1.33MeV are appropriately adjusted.
|
|
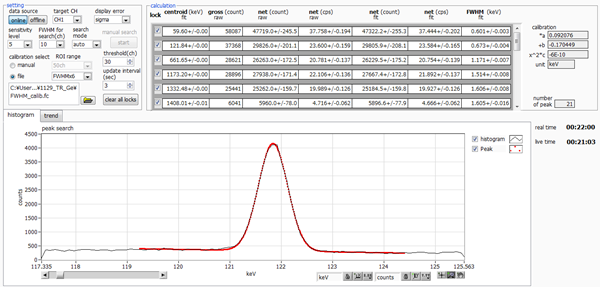
Fig. 8 ROI range file @ 122keV
|
|
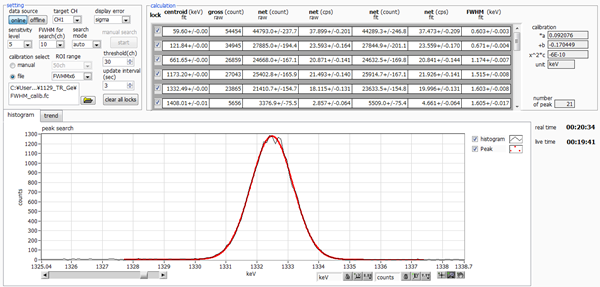
Fig. 9 ROI range file @ 1.33MeV
|
|
Now, I will explain the peak search of peak search analysis, which is one of the spectrum analysis functions installed in Techno AP's DSP and MCA.
This is a widely used method that is based on the Ministry of Education, Culture, Sports, Science and Technology's "Gamma-ray Spectrometry Using Germanium Semiconductor Detectors" revised in 1992.
The peak search is performed using the second-order differential method using a Gaussian function second-order differential filter. The first derivative changes from positive to negative at the center of the peak,
and the second derivative becomes minimum at the center of the peak. The second-order differential filter function differentiates a Gaussian function twice with a width ‘w’ that is 1 to 2 times the FWHM of the spectrum.
|
|

|
|
To make it easier to understand, we use equation Eq. (5) with FWHM ‘W’ as a parameter from the standard deviation,
|
|

|
|

|
|
After replacing x-μ=j and differentiating it twice with respect to j, we get
|
|

|
|
Here, if ROI range is fixed to manual, the accuracy will not be optimal because the filter will be created using
channels specified from low energy to high energy.
As mentioned earlier, in order to perform a precise peak search, select file and specify the FWHM calibration file. The peak search will be performed by varying the FWHM value 'w' from
low energy to high energy.
ROI range will also be automatically adjusted to an appropriate width using FWHM calibration file. Using the filter obtained from Eq.6, calculate the smoothed second-order derivative value N" and its counting error σN". The integration area is three times the FWHM ‘w’.
|
|

|
|

N(i+j): Counting value of the (i+j)-th channel
|
|
Regarding peak determination, when the second-order differential coefficient
N"[i] of the i channel satisfies the condition N"[i] < -k・σN"[i],
a peak exists near the i channel. K is Set it to 2.5 to 4 times. K is called
Sensitivity Level in peak search analysis, so adjust it here.
Let's examine the spectrum data N in Fig. 10 with the human eye. It is immediately clear that the peak at 2480ch is fully detectable.
Next, the peak around 2500ch is barely detectable. Some might even consider it as noise.
As for the region around 2455ch, it is hard to say whether it is noise
or not. Even if you compare the second-order differential coefficient N''
and the error σN'', it is evident that it aligns with the perception of
such individuals. The sensitivity level in this case is 3.
I believe it is clear that the second-order differential method is a very effective peak search method.
|
|
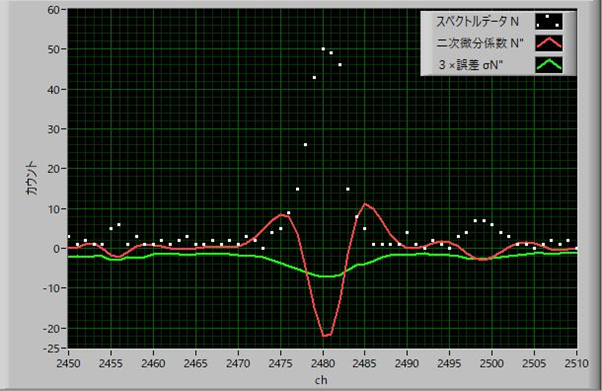
Fig. 10 Second derivative filter and error
|
|
Our application software is developed using National Instruments' LabVIEW, a powerful graphical programming language with a robust user interface(UI).
However, for operations that require repetitive calculations , such as peak search, where calculation speed is critical, we implement the code in C and create a DLL(as shown in Fig.11) to enable real-time computations.
|
|
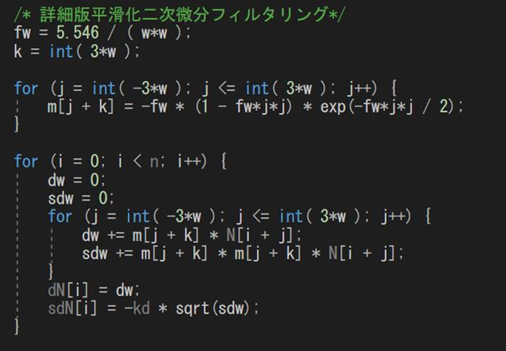
Fig. 11 Peak Search Code
|
|
The more statistics you accumulate, the closer the results will be to the
true values, so the difference in the calculation results between main screen and peak search analysis will diminish.
main screen is essentially software that automates manual calculations following a predefined procedure., so when there is extremely little statistical data, it may not be possible to calculate or the numbers may be quite random.
On the other hand, Peak search analysis performs best with limited statistical data. Gaussian fitting after peak
search works effectively even when there are few statistics and outputs
numbers close to the true value. Additionally, the associated error can
also be output, which enhances the reliability of the measurement data.
In this article, we focused solely on the peak search. We plan to cover
topics such as No.2 (Calculating each parameter using Gaussian fitting)
and No.3 (After calculating the peak area, determining the net counting
rate from live time).
Now, all of our employees will do their best to create even better products.
Thank you very much for your support.
|