|
In this instance, we'll explain the Gaussian fitting used in peak search analysis,
one of the key features of our DSP and MCA spectrum analysis capabilities.
|
|
Techno AP's Gaussian fitting method for peak search analysis employs a
nonlinear least squares approach using the Levenberg-Marquardt method.
This method ensures rapid convergence and stability, enabling precise determination
of optimal values. Initial parameter values are automatically derived from
peak search data, simplifying setup.
Here’s a straightforward explanation of the algorithm:
|
|
First, we work with spectral data yi and a model function f(xi;a), which consists of a Gaussian function + a linear term.
|
|

|
|
Let's unify the parameter of Eq.(1) with a.
|
|

|
|
1. Give the independent variable xi of the model function f(xi;a) and set the initial value of the parametera a(0).
2. Define χ2 (sum of weighted residual squares) Eq. (3) to evaluate the fit between data yi and modelf(xi;a) and calculate χ2(a(0)) . Let this value be χ02.
|
|

|
|
3. Create an m×m symmetric matrix αjk by computing the partial derivatives of f(xi;a) with respect to each parameter.
|
|

|
|
4. Create an m-by-1 matrixβj by multiplying the residual by partial differentiation.
|
|

|
|
5. α' is obtained by multiplying the diagonal component αjj by the coefficient to be emphasized (1+λ).
|
|

|
|
6. Solve the simultaneous equations Eq. (7) to find δa, and calculate χ2(a(0)+δa).
|
|

|
|
7.If χ2>χ02, multiply λ by 10, and return to step 5 to try again.
8. If χ2-χ02<εχ2, the calculation is complete. ε is the convergence criterion.
9. If χ2<χ02, set aj=aj0,χ02=χ2, set λ to 1/10, and return to step 3.
|
|
The Levenberg-Marquardt method initially increases λ during the first stage of fitting (when (aj(0) is not close to the true value),
emphasizes the diagonal components, and causes the gradient of χ² to decrease sharply. In this case, since αjj is large, the change in δα is small.
As χ² steadily decreases and λ approaches 0, the method moves the variation in δα more boldly, bringing it closer to Newton's method, allowing for rapid convergence.
|
|
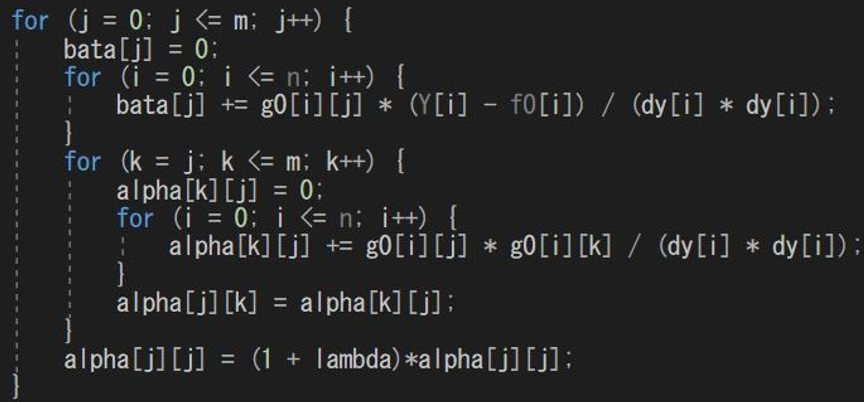
Fig.1 Gauss fitting code, part of the code
|
|
There are free libraries for nonlinear least squares methods like Gaussian
fitting available for interpreted languages such as Python and ROOT, which
excel at numerical computations.
Initially, I considered using these libraries, but since our application
requires integration as a DLL, and paid options like Peak Fit and MATLAB
support this, I realized we needed a custom solution.
Given the need for flexibility and customization, I opted to develop the
solution in-house. Similar to our peak search functionality, this implementation
is coded in C and compiled into a DLL (Fig. 1) ensuring high-speed performance
and enabling real-time calculations.
|
|
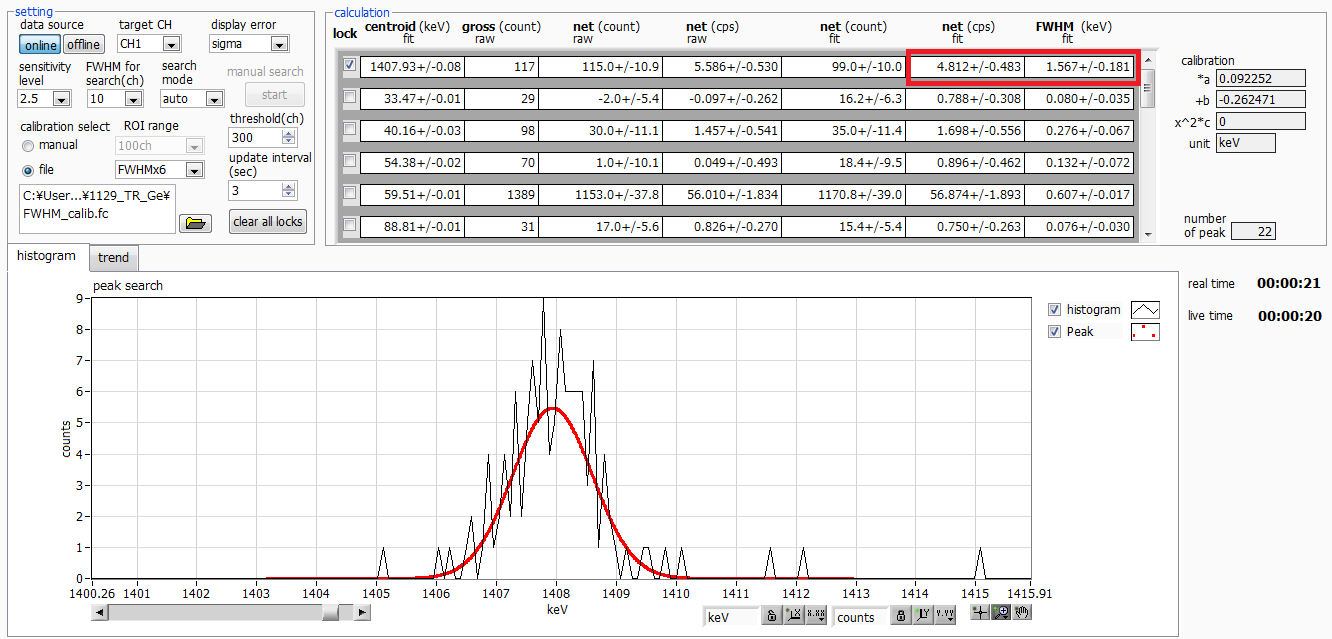
Fig.2 Spectrum with few statistics
|
|
Firstly, Gaussian fitting offers the advantage that it can provide reasonable values (Fig. 2) even when statistical data is limited (Fig. 3).
Its high reproducibility ensures stable results without the need for extended measurement periods.
|
|
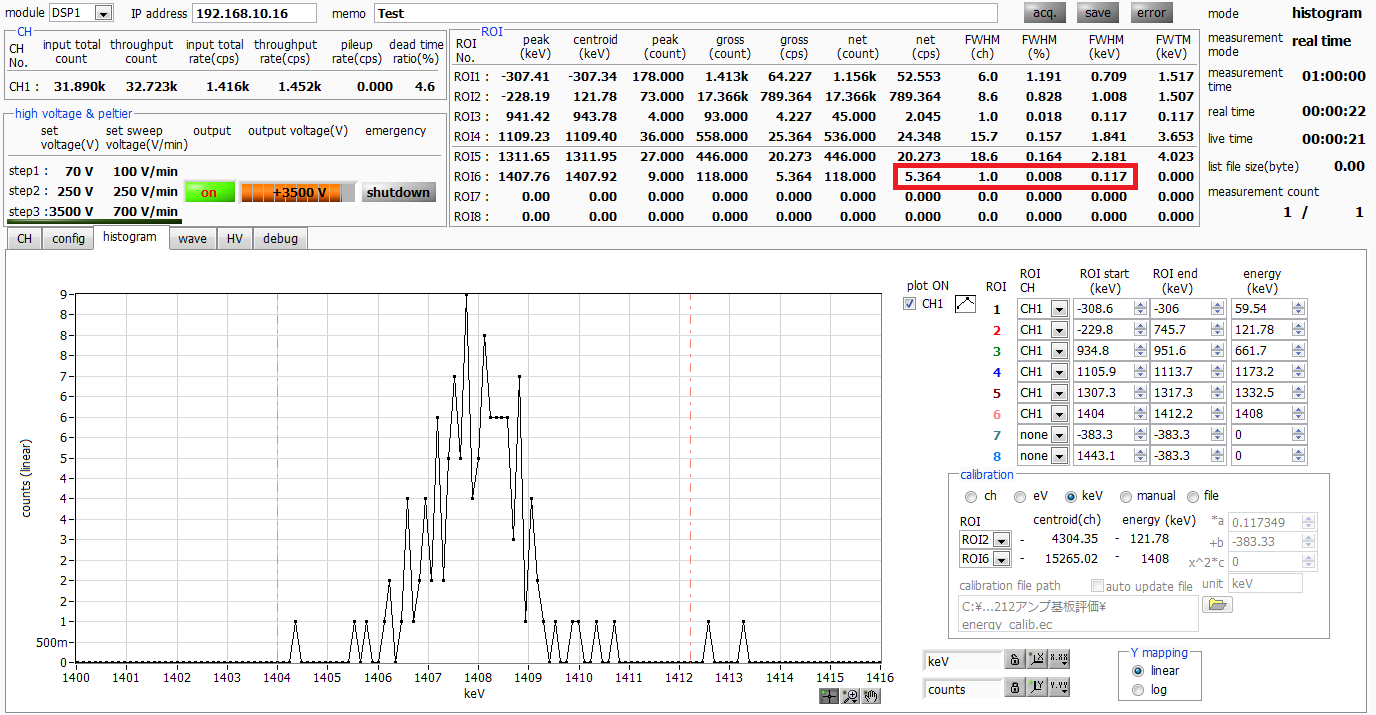
Fig.3 Manual calculation process on main screen
|
|
Additionally, when the full scale is set broadly, such as 10 MeV (Fig. 4), and focus is on lower energies (e.g., 121.8 keV), fine binning with 16 kch histogram channels may lead to inadequate channel resolution (Fig. 5).
The value net(cps)raw, derived from direct measurements, often proves smaller than net(cps)fit calculated via Gaussian fitting.
This discrepancy is likely due to insufficient channel resolution. Gaussian fitting remains effective in such scenarios.
|
|
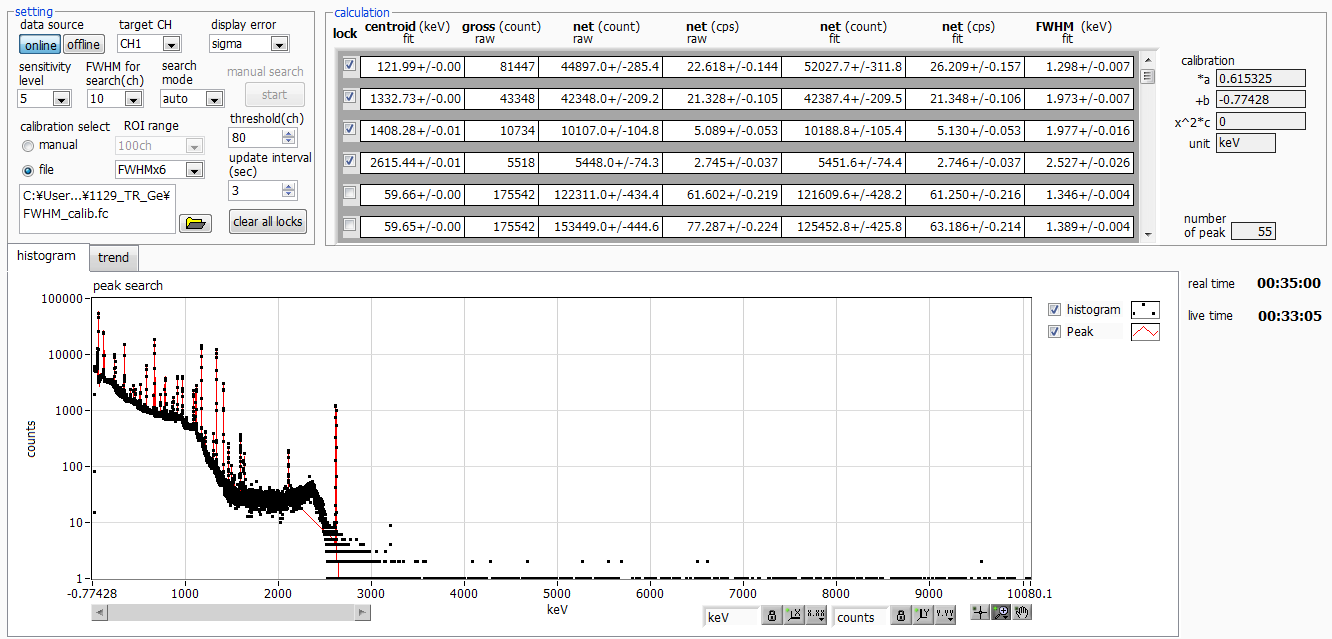
Fig.4 10MeV full-scale γ-ray spectrum
|
|

Fig.5 Spectrum with insufficient channel resolution
|
|
Although the application automatically derives initial values from peak search results and applies Gaussian fitting accordingly,
rendering manual intervention unnecessary, real-time updates of information add significant utility.
|
|
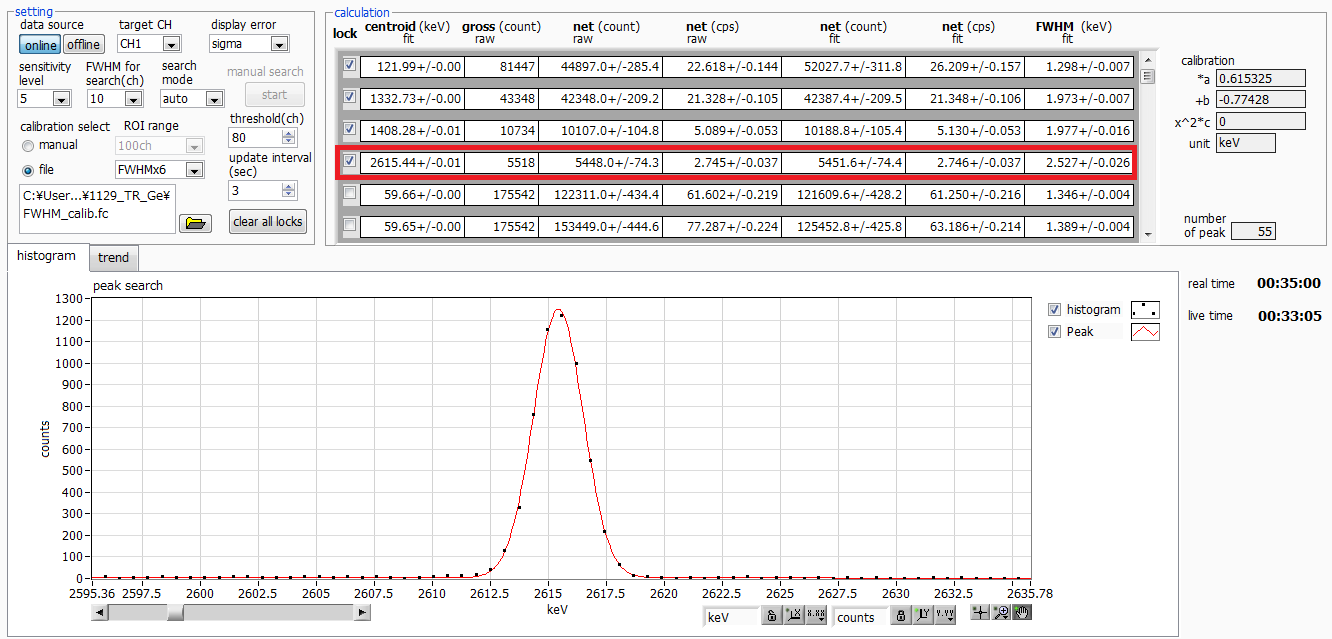
Fig.6 2.6MeV peak
|
|
Fig.6 shows the peak of the 2.6 MeV γ-ray of Tl-208 from the natural radiation thorium series generated by the thorium-containing tungsten electrode rod used in circulating TIG welding.
This is useful when testing high-energy gamma rays.
|
|
Fig.7 is a spectrum measured for 35 minutes at a full scale of 3MeV.
Please pay attention to the blue frame.
|
|
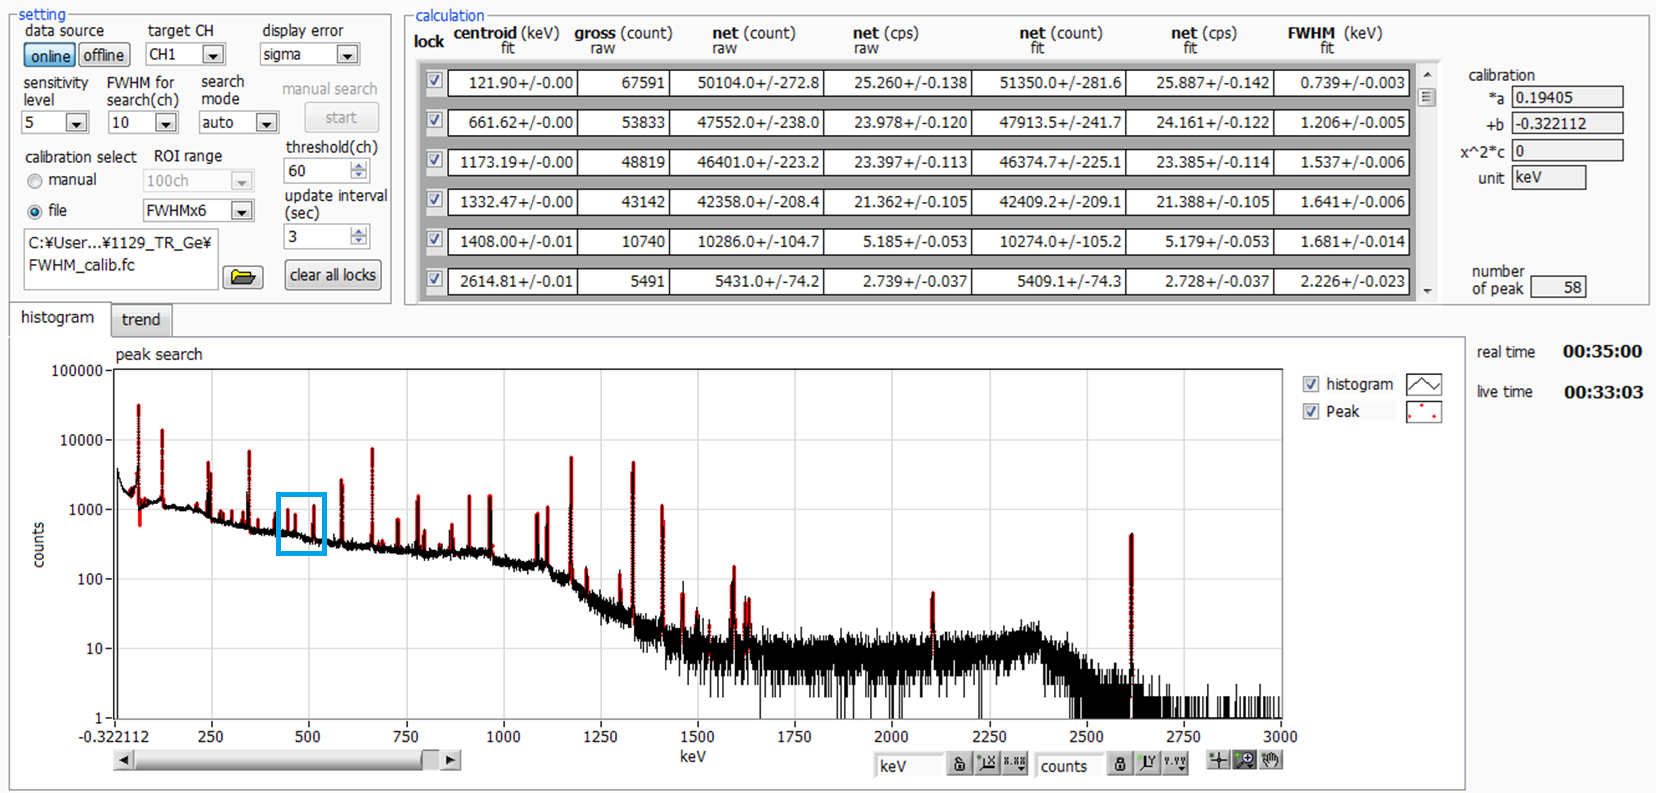
Fig.7 3MeV full-scale γ-ray spectrum
|
|
Fig.8 shows the spectrum with the blue frame enlarged. Measured for 1 minute. 443keV and 463keV seem to be still hidden,
|
|
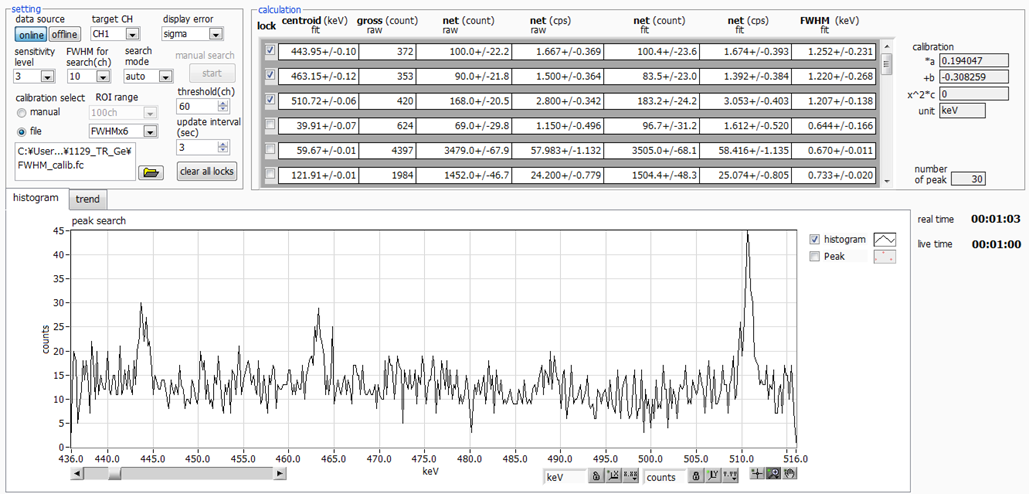
Fig.8 Peak that is slightly buried
|
|
Gauss fitting is applied properly. (Fig.9)
|
|
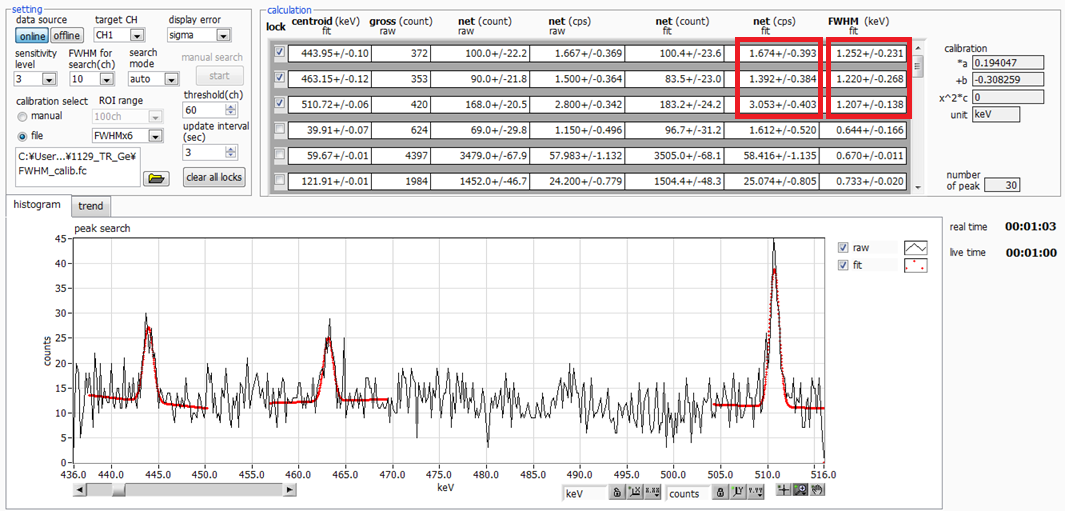
Fig.9 1 minute measurement of the fitted spectrum
|
|
Compare the three peaks in the 1min spectrum (Fig.9) and 10min spectrum
(Fig.10).
I believe net(cps)fit and FWHM(keV)fit are within the error range.
|
|
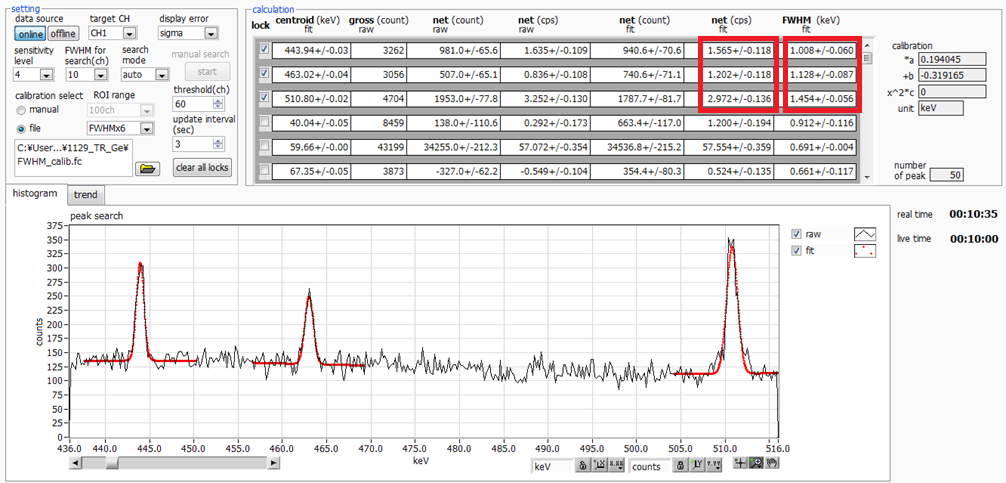
Fig.10 Spectrum 10min measurement with fitting
|
|
All of our employees will do their best to create even better products.
Thank you very much for your support.
|
|
References
[1] Willaim H. Press, NUMERICAL RECIPES in C, (Gijutsu-Hyoron Co., Ltd., 1993)
|